Monitoring High-Performance Computing at scale -introduction Normal 0 21 false false false EN-US /* Style Definitions */ table.MsoNormalTable {mso-style-name:"Normale Tabelle"; mso-tstyle-rowband-size:0; mso-tstyle-colband-size:0; mso-style-noshow:yes; mso-style-priority:99; mso-style-parent:""; mso-padding-alt:0cm 5.4pt 0cm 5.4pt; mso-para-margin:0cm; mso-para-margin-bottom:.0001pt; mso-pagination:widow-orphan; mso-hyphenate:none; font-size:12.0pt; font-family:"Cambria","serif"; mso-ascii-font-family:Cambria; mso-ascii-theme-font:minor-latin; mso-hansi-font-family:Cambria; mso-hansi-theme-font:minor-latin; mso-ansi-language:EN; mso-fareast-language:EN-US;} Normal 0 21 false false false EN-US Normal 0 21 false false false EN-US and worked example
Antoine Dauptain and Elsa Gullaud

(Photo Kevin Ku ). There is still a long way to go to before using Tier-O High Performance Computers for engineering design every day. Moving from a handful of demonstration runs to the desired mass production will require special pair of glasses to get insights on how end-users actually used each software on each machine.
Reading time – introduction: 6 min
Reading time – worked example: 15 min
Only a tiny fraction of high-performance simulations is useful. Most will fail, or be wrong, or simply be forgotten. How can the process be made more efficient?
What makes mass-production HPC simulations different
High-performance computing (HPC) has uses ranging from fundamental research to industrial design. The EXCELLERAT European Centre of Excellence focuses on promoting the use of next-generation HPC resources for engineers. Putting tools built for academic experts into the toolbox of active engineers is the usual technology acceptation challenge, often known as “crossing the chasm”.
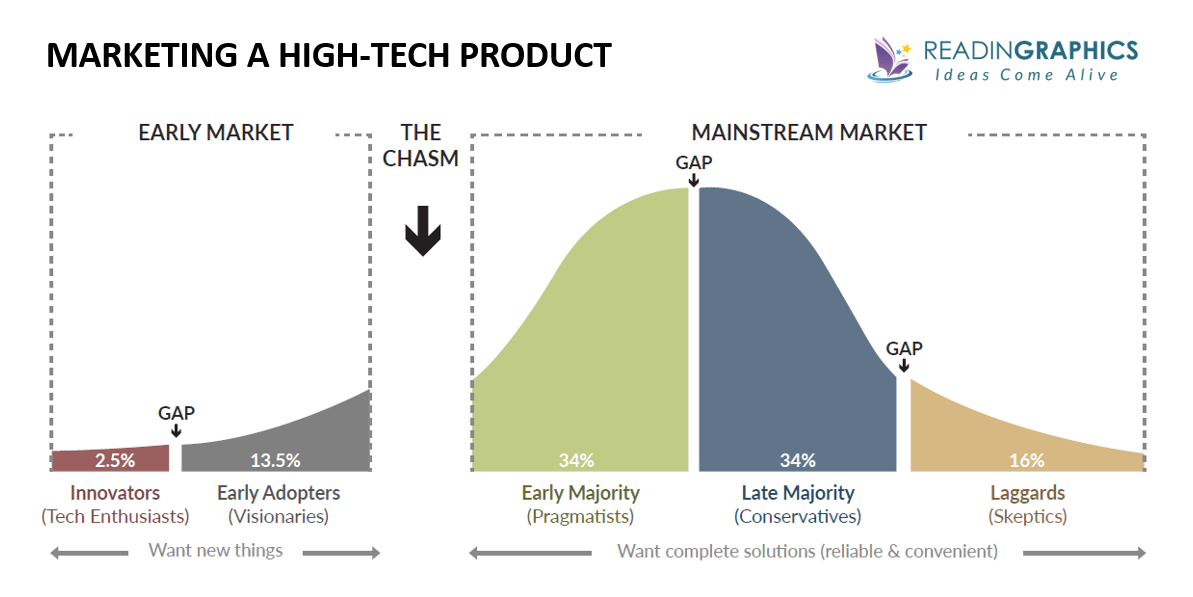
The chasm analogy, taken from one of the multiple books on marketing high-tech products.
Most users of HPC in industry are early adopters. They can produce simulations for complex industrial applications, and sometimes “farm” (repeating variation of the same run) around a specific simulation. But conquering the early majority means to drastically increase the amount and the success rate of simulations set up by non-experts. From the engineering point of view, a successful simulation must meet these criteria:
- The set-up is correct.
- The modeling is correct.
- The job succeeded.
- The output gave insights.
- Steps 1–4 can be done in an affordable time.
- The same job can be restarted weeks or years later.
These constraints shift the main objectives. HPC performance can become a second-order concern, when not running the wrong simulation or not losing a good simulation saves more time and money than a 20% speed improvement. This is why software developers need a specific feedback to focus their efforts on.
The following strip, based on a true story, illustrates the frequent practical problems: the simple identification of failed runs in a mass production remains a challenge.

To be more precise, while all HPC users know how much of an allocation was spent, there is no systematic report on what was simulated or how many attempts it took, and even less on the nature of the failures.
This EXCELLERAT Centre of Excellence white paper illustrates the importance of making such feedback available to the customer.
How feedback can help in “crossing the chasm”
Here are some examples of feedbacks we can use to learn about and improve our simulation workflow. The reader can jump to the worked example for more technical details.
As we are talking about high performance computing, this section starts with monitoring the actual performance of a large set of simulations:
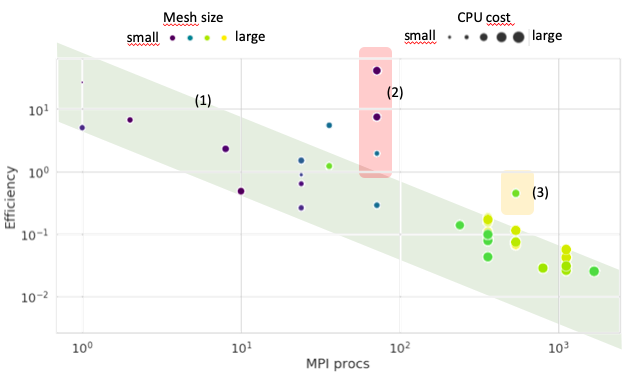
This scatter plot can pin-point the under-performing cases and trigger a posteriori investigations.
The actual performance of simulations look like a speed-up figure with a lot of outliers. Each point is a simulation, and all should collapse to the 1/cores trend (The lower bound of the green diagonal stripe).
Next is the analysis of crashes. If we add an error code to each simulation log, the distribution of these error codes shows directly the weak points of the workflow.
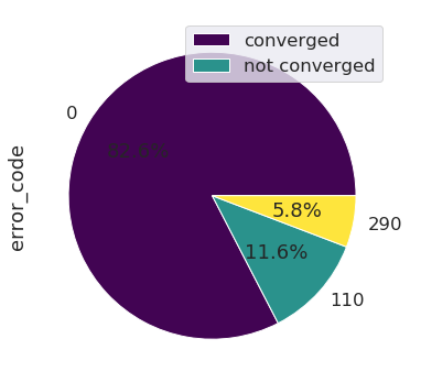
This error code pie chart indicates that 80% of jobs succeed (Error code 0). The main crash causes were found: at the setup, either when filling the input file (Error code 110) or the binary databases for the boundaries Error code (290).
According to this figure, there was in the selected set of simulations a negligible amount of run-time crashes compared to prior-to-run crashes. In other words, some effort is lost in trial-and-error setup corrections; an improvement of the user-experience is needed.
Another challenge is to quantify a posteriori the “kind of runs” that weighted on the final bill. Basically, we need an unsupervised approach to figure out if there were distinct families of simulation on the batch. This can be done with machine-learning techniques, namely a principal component analysis (PCA) followed by a clustering.

A Principal Component Analysis of the simulation parameters can identify several “families” of runs. In this batch, two major groups emerge, followed by minor groups.
Once the PCA/clustering is done, the runs are distributed between several groups. The last remaining step is finding unique traits in each group. For example, we will look here if the numerical set ups differ between each group.
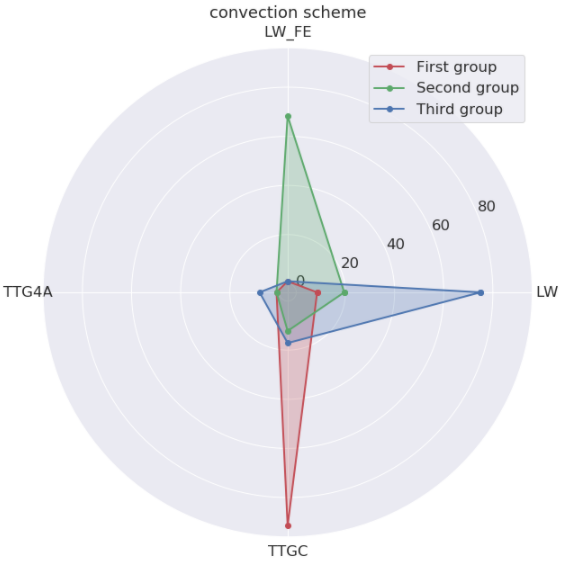

The convection scheme and artificial viscosity are related to the accuracy of the fluid motion.
These figures show that the first group is a high precision batch (TTGC for Third order Taylor-Galerkin Compact), the second a normal precision batch (LW for Second order Lax-Wendroff) and the third an experimental normal precision batch (LW-FE, Lax-Wendroff on Finite-Element, seldom used). This insight will therefore tell us if the high precision batch was responsible for a large share of the consumed HPC resources. Read the expert part if you want more in-depth explanation of the procedure.
Takeaway
This white paper underlines the need for proper feedback to code developers when the simulation workflow must scale up. This feedback can focus on performances, crashes, users’ habits or any other metric. Unfortunately there is no systematic method available yet.
Your organisation should consider adding a feedback process to your simulation workflow if:
- HPC costs are not negligible.
- The production is hard to track by a single worker (>1000 jobs per year).
- HPC simulations are part of your design process.
- The usage will span several years.
However, there are still many situations where it would be too burdensome:
- HPC tools are in the demonstration stage only.
- The volume of simulation is still manually manageable.
- HPCs tool are used in a break-through action, re-use is not expected

Ice core researchers drilling at the EastGRIP ice core site, Greenland. Can we learn about our simulations in a similar fashion?
Limits of accounting today
HPC clusters usually rely on batch submission software (e.g., Slurm), which offers a command line interface for users to request compute resources, and allocates these resources according to the rules defined by the system administrator. Submission software includes activity logs with the goal of billing CPU-hours according to each user’s consumption. The following figures give an overview of the distribution of consumption between users.
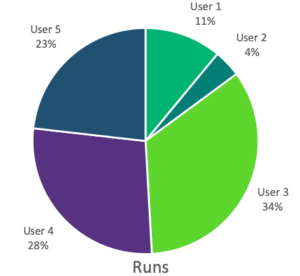
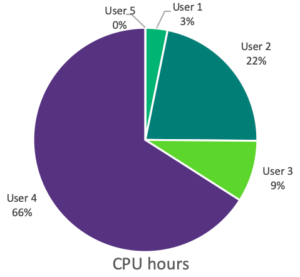
Distribution of the simulation metrics per user. User 5 is invisible because his jobs are small. User 4 used 66% of the total allocation with only 28% of the jobs submitted.
While CPU-hours are directly billed to the user, each run must be started by hand, hence the number of runs is an indication of the associated labour costs. Both of these metrics are therefore useful to assess the total simulation costs.
The data also reveals user habits, and can inform the system administrator in tuning the job scheduling rules and improving productivity. In the following graphs, users have uneven usage patterns throughout the week.

Distribution of the simulation starts per days of week. There is naturally less activity at the weekend. This is why most clusters usually offer a production queue (8 to 12 hours) on weekdays, and a weekend queue (48 to 72 hours). A lower activity is visible on Fridays, hinting maybe at the possibility of a Happy Debug Friday queue if the charge is dropping on a weekly basis.
Here is what accounting looks like practically. Queries are done on the jobs log, for example with a command line in the terminal of the machine:
>slurm-report.sh -S 090120 -E now -T -g cfd
In this case, the job scheduler is SLURM. The command slurm-report.sh gathers information from September 1st -S 090120 to today -E now for the users group cfd -g cfd. The output looks like this:
JobID JobName Partition Group Account AllocCPUS Elapsed User CPUTimeRAW
——— ———- ———- ——— ———- ———— ———— ————– —————
401637 batc prod cfd default 72 12:00:29 anonymous1 3112488
401643 lam prod cfd default 540 12:00:22 anonymous1 23339880
401805 F53NTPID prod cfd default 540 12:00:22 anonymous2 23339880
401808 F53A1NTP prod cfd default 540 12:00:22 anonymous2 23339880
401813 OFCo706 prod cfd default 540 12:00:22 anonymous2 23339880
401815 OFCo530 prod cfd default 540 03:03:16 anonymous2 5937840
401837 A_STABLE prod cfd default 540 07:54:25 anonymous6 15371100
401873 batc prod cfd default 72 00:00:00 anonymous1 0
401875 lam prod cfd default 540 00:00:00 anonymous1 0
401916 labs_lolo prod stg-elsa default 540 00:04:16 anonymous3 138240
401999 NEW_TAK prod cfd default 540 05:22:30 anonymous4 10449000
402004 Z08_URANS prod elsa default 180 07:47:19 anonymous5 5047020
(…)
There are now groups and tools focused on extracting information from these user databases. For example the UCit is developing a data science-based framework called Analyse-IT to explore the database. The database is gathering only the information the job scheduler is aware of. The typical job profile is, at best:
- Job name
- User login and group
- Account (if needed)
- Executable name
- Queue (Nb of cores)
- Duration requested
- Memory requested
- Start and end time
- Exit code
The executable name, user-defined, is often not exploitable (e.g. /awesomepath/new_version.exe). The exit code must also be handled with care because no standard of exit codes exists for an HPC software.
The conclusion is therefore simple, there is neither engineering-related data nor software-related data under the watch of the job scheduler.
Where to find new information
The accounting database is not tracing engineering information, e.g. which engineering phenomena have been taken into account, the size of the computations, the additional features, etc… These elements are forecast at the beginning of the year to size the CPU allocation requested. All the data is in the setup. The challenge is to gather it across all runs.
The accounting database is not tracing software information either, e.g.: which version was used, the actual performances, the job crash origin, etc… The software usually provides the answers through a log file, one per run. The same challenge appears: gathering the log files across all the runs.
Coring of simulation logs
The ideal solution would be to daily feed a dedicated database, like the accounting one. But designing a system, tackling permissions and confidentiality issues, defining common definitions of performances and crashes is complex and many hurdles lie ahead. We will depict here a “brute force” approach to make some baby steps in this direction.
The simulations done by engineers for design are, usually, saved on archive disks. A large amount of the relevant setups and log files are still available at the end of the year. We can tap these disks to get a partial, but quantitative, overview of what was done.
Here follows extracts of a setup file and a log file for the Computational Fluid Dynamics solver AVBP. The input file run.params is a keyword-based ASCII file with several blocks depending on the complexity of the run.
$RUN-CONTROL
solver_type = ns
diffusion_scheme = FE_2delta
simulation_end_iteration = 100000
mixture_name = CH4-AIR-2S-CM2_FLAMMABLE
reactive_flow = yes
combustion_model = TF
equation_of_state = pg
LES_model = wale
(…)
$end_RUN-CONTROL
$OUTPUT-CONTROL
save_solution = yes
save_solution.iteration = 10000
save_solution.name = ./SOLUT/solut
save_solution.additional = minimum
(…)
$end_OUTPUT-CONTROL
$INPUT-CONTROL
(…)
$end_INPUT-CONTROL
$POSTPROC-CONTROL
(…)
$end_POSTPROC-CONTROL
Most of the missing information about the configuration are present. However, due to the jargon, a translator is needed. For example, few people except AVBP users know that pg is the keyword for a perfect gas assumption.
Then comes the AVBP typical log file, presented hereafter, with sections cropped for readability.
Number of MPI processes : 20
__ ____ _____ __ _______ ___
/\ \ / / _ \| __ \ \ \ / /____ / _ \
/ \ \ / / | |_) | |__) | \ \ / / / / | | |
/ /\ \ \/ / | _ <| ___/ \ \/ / / / | | | |
/ __ \ / | |_) | | \ / / / | | _ | |
/_/ \_\/ |___/|_| \/ /_/ (_)___/
Using branch : D7_0
Version date : Mon Jan 5 22:03:30 2015 +0100
Last commit : 9ae0dd172d8145496e8d62f8bd34f25ae2595956
Computation #1/1
AVBP version : 7.0 beta
(…)
—-> Building dual graph
>> generation took 0.118s
—-> Decomposition library: pmetis
>> Partitioning took 0.161s
__________________________________________________
| Boundary patches (no reordering) |
|__________________________________________________|
| Patch number Patch name Boundary condition |
| ————— ————– —————— |
| 1 CanyonBottom INLET_FILM |
(…)
| 15 PerioRight PERIODIC_AXI |
|__________________________________________________|
______________________________________________________________
| Info on initial grid |
|_____________________________________________________________|
| number of dimensions : 3 |
| number of nodes : 34684 |
| number of cells : 177563 |
| number of cell per group : 100 |
| number of boundary nodes : 9436 |
| number of periodic nodes : 2592 |
| number of axi-periodic nodes : 0 |
| Type of axi-periodicity : 3D |
|_____________________________________________________________|
| After partitioning |
|_____________________________________________________________|
| number of nodes : 40538 |
| extra nodes due to partitioning : 5854 [+ 16.88‰] |
|_____________________________________________________________|
(…)
—-> Starts the temporal loop.
Iteration # Time-step [s] Total time [s] Iter/sec [s-1]
1 0.515455426286E-06 0.515455426286E-06 0.357797003731E+01
—> Storing isosurface: isoT
50 0.517183938876E-06 0.258723148413E-04 0.184026441956E+02
100 0.510691871555E-06 0.515103318496E-04 0.241920225176E+02
150 0.517872233906E-06 0.772251848978E-04 0.239538511163E+02
200 0.523273983650E-06 0.103271506216E-03 0.241928988318E+02
(…)
27296 0.547339278850E-06 0.150002454353E-01 0.241129046630E+02
—-> Solution stored in file : ./SOLUT/solut_00000007_end.h5
—> Storing cut: sliceX
—> Storing cut: cylinder
—> Storing isosurface: isoT
(…)
—-> End computation.
________________________________________________________________________________
______________________________________________________
| 20 MPI tasks Elapsed real time [s] [s.cores] [h.cores] |
|_____________________________________________________|
| AVBP 1137.27 0.2275E+05 0.6318E+01 |
| Temporal loop 1134.31 0.2269E+05 0.6302E+01 |
| Per iteration 0.0416 0.8311E+00 |
| Per iteration and node 0.1198E-05 0.2396E-04 |
| Per iteration and cell 0.2340E-06 0.4681E-05 |
|_____________________________________________________|
—-> End of AVBP session
***** Maximum memory used : 12922716 B ( 0.123241E+02 MB)
Here again, a lot of information is present: version number, performances indicators, problem size, etc…
The cause of crashes is still missing. However, there is a way out because log files are written in chronological order.
| If the log file stops before: | the error code is: | Which means: |
| Input files read | 100 | Ascii input failure |
| Initial solution read. | 200 | Binary input failure |
| Partitioning took. | 300 | Partitioning failure |
| —-> Starts the temporal loop. | 400 | Pre-treatment failure |
| —-> End computation. | 500 | Temporal loop failure |
| —-> End of AVBP session. | 600 | Wrap up failure |
| all flags reached | 000 | Success |
These error codes can be code-independent. However, one can increase the granularity of the error codes by adding code-dependent custom error codes. For example in AVBP, a thermodynamic equilibrium problem is raised by the error message Error in temperature.F which can return a specific code (e.g. 530) to keep track of this particular outcome in the temporal loop.
Gathering the data
In this brute force approach, a script, the “crawler”, is run on the filesystem complying with the Unix permissions. This data-mining step can take some time. Here is a rough description of the actions used for this illustration:
- First search for the log files, and discard duplicates with a checksum
- Find the corresponding setup file.
- Parse the log file with regular expressions (regexps) and compute the error code.
- Parse the setup file, again with regexps.
- Keep that of the creation date and the login of the creator.
- File this data into a database.
The final database is then filled with both pre-run information (the setup, version time, and username) and post-run information (error codes, performances, completion).
Remember the two limits of this approach:
- This database will not take into account runs erased during cleanup operations. It cannot be considered exhaustive, unless the crawler is run regularly with a scheduler like a crontab.
- All runs are equally represented (with an equal interest). In reality only one out of ten runs, at best, is actually contributing to a motivated engineering conclusion. Some runs are only taken to check to versions of the same code give similar results. The added value of a specific run, compared to another, is subjective.
There is however a nice database to investigate…
Quantify the crashes
Software support is the elephant in the room taking most of the time but never mentioned. We were talking about reducing the stress on the support team, maybe we can help them to target the weakest points of the code?
This pie chart highlights the percentage of runs that went through and those which crashed, due to different errors. An error code of ‘0’ indicates a run that went through. Any other error code means it crashed.

This shows that on this database, very few runs actually crashed during the time loop. The main crash causes were found at the setup, when filling the input file (110) of the binary databases for the boundaries (290).
Here we see that almost 12% of the runs crash due to an error code of ‘110’ which means bad filling of the input file. The CPU hours are not wasted, but the end-user hours are, and this builds resentment. Various ideas could pop:
- Maybe the parser is too strict?
- Or the documentation could be improved?
- Could it be that some dialogues are giving the wrong mental model?
Here the support team should not give in to the temptation to guess. With the new database, one can focus on the runs that crashed and get new insights, either by manual browsing, or a new data science analysis if there are too many.

Some users – an undisclosed but substantial number – run over the time limit, losing the last stride of unsaved simulation in the process. The reason: downsizing the run could stop it before the end of the allocated time, which is seen as less efficient.
Actual versus expected performance
The HPC pledge: my code is faster on a higher number of processors. On a priori benchmarks with controlled test cases, the figures are nice and clean. What about an a posteriori survey on the past batch of simulations?
Efficiency – the time needed to advance one iteration (a computation step), divided by the number of degrees of freedom (the size of the mesh) – is used to compare machine performances. Units are µs/iteration/degree of freedom (d.o.f).
It is important to note that efficiency comparisons between two different codes are deceptive: the iteration is a code-specific concept, and the d.o.f. quantity can be difficult to convert.
In one way or another, efficiency must linearly decrease with the number of cores.

Efficiency measured by the code in the log file on a large batch of past simulations. The ideal linear decrease is the green stripe.
Most of the jobs are indeed showing efficiency decreasing linearly with the number of processes. In this linear zone (1), bigger meshes efficiency is less good, drifting away from the lower bound of the linear zone, but these simulations often use more equations and models. Some CPU consuming tasks show terrible performances (2) and should be investigated. A large simulation is also underperforming (3).
We can see the linear trend with the number of MPI processes. This overall trend is right. Unfortunately, there are terrible outliers: 2 orders of magnitude slower on the same code and same machine cannot be taken lightly. A special investigation should focus on this.
If we dig further in the code-dependent figures, the cache of AVBP can be optimised with the ncell_group parameter. As this is configuration dependent and features dependent, the process of finding the right tuning has always been heuristic. Here we look at a heat-map of the ncell_group parameter versus MPI processors to go even further and check whether the association of both parameters is right.
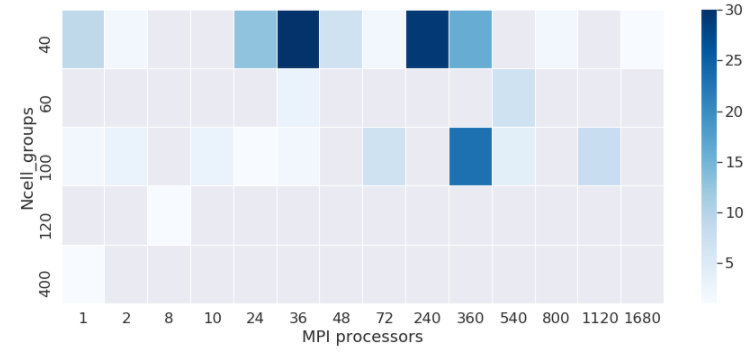
Survey of which ncell_group is tested by the user to improve their simulations on the partitions.
The fact that only five values are found is the proof very few people take the time to optimise the cache with respect to their simulation.
Version acceptation
HPC users can exhibit a lot of inertia in their version upgrades. Here we will track the adoption rate of new versions among users.
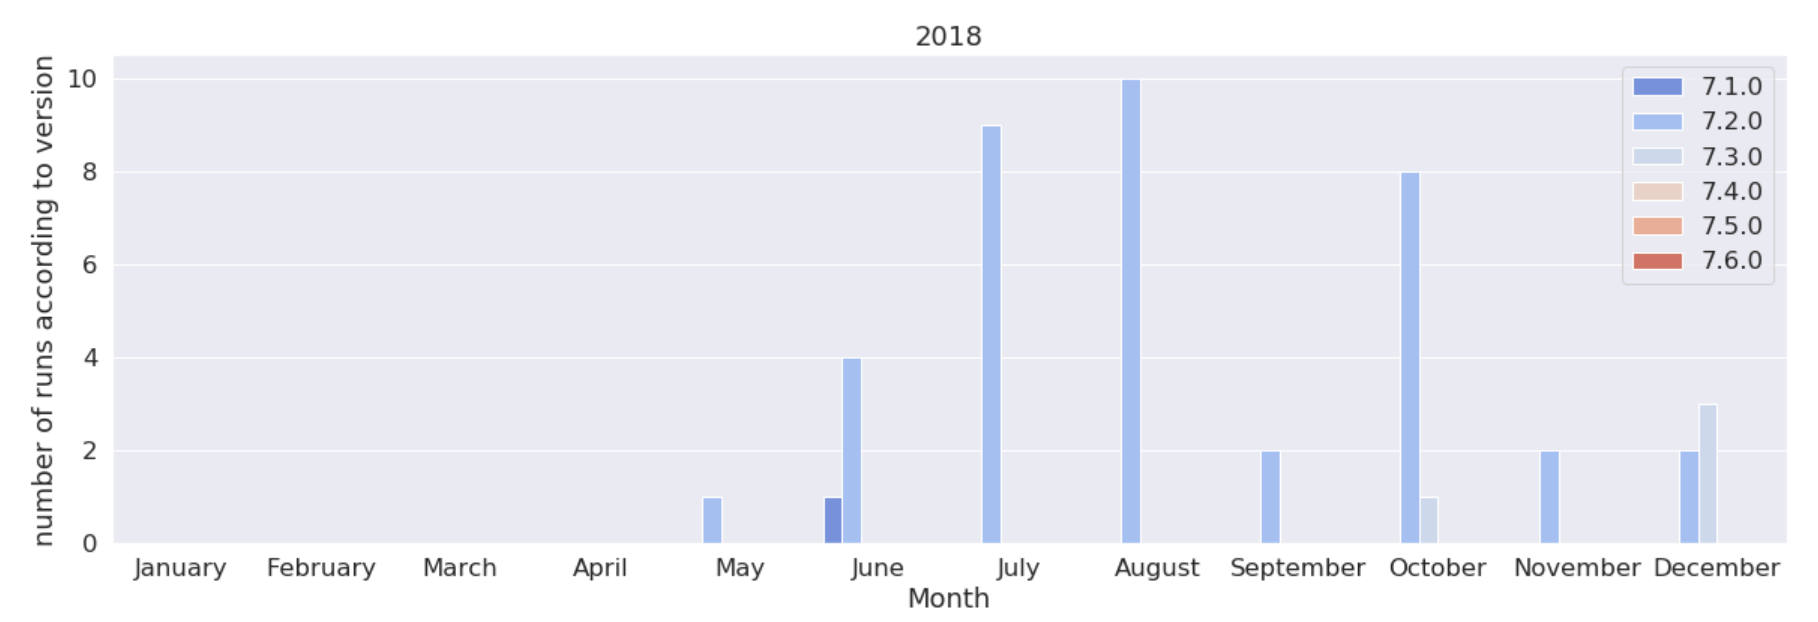
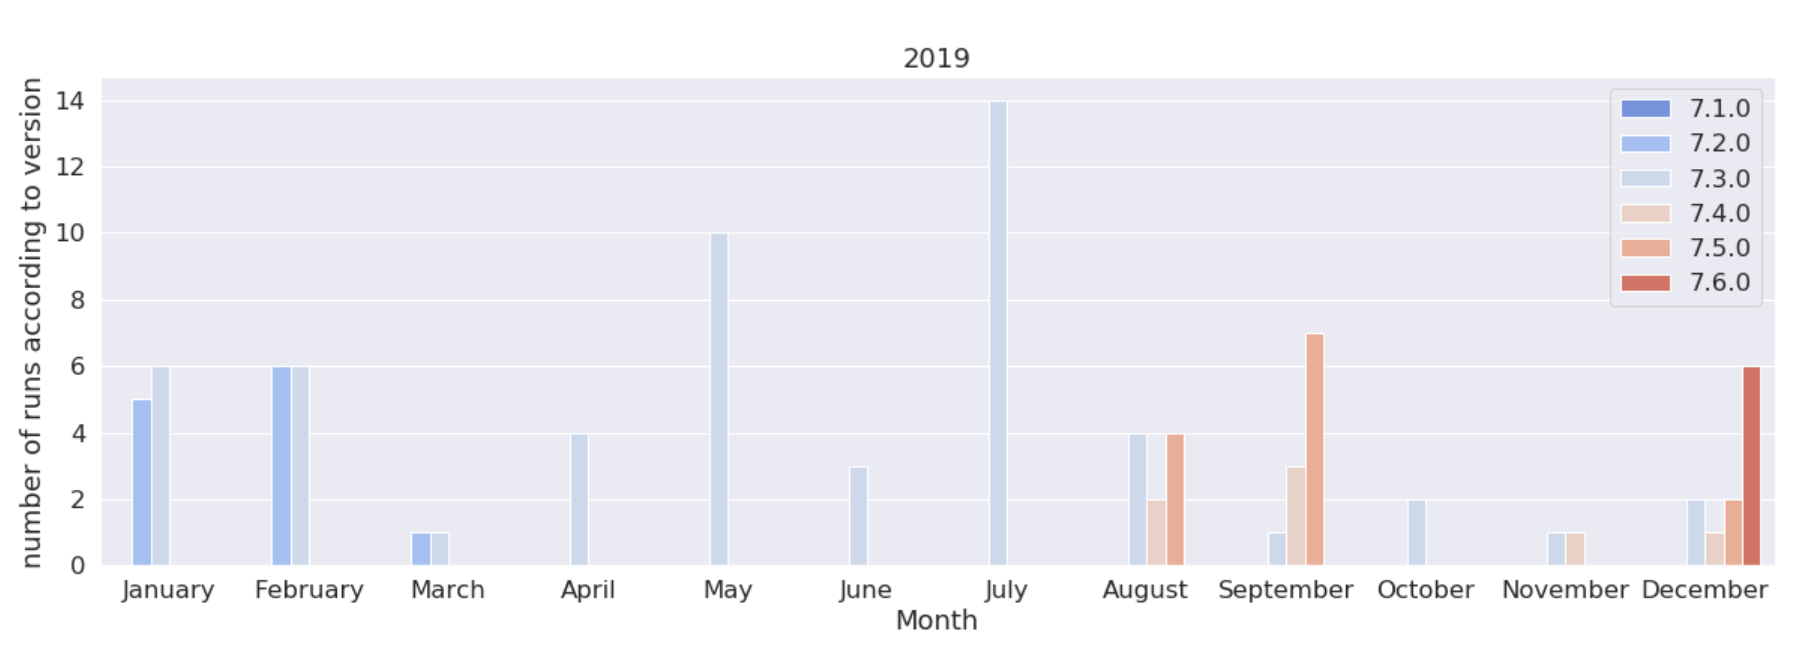
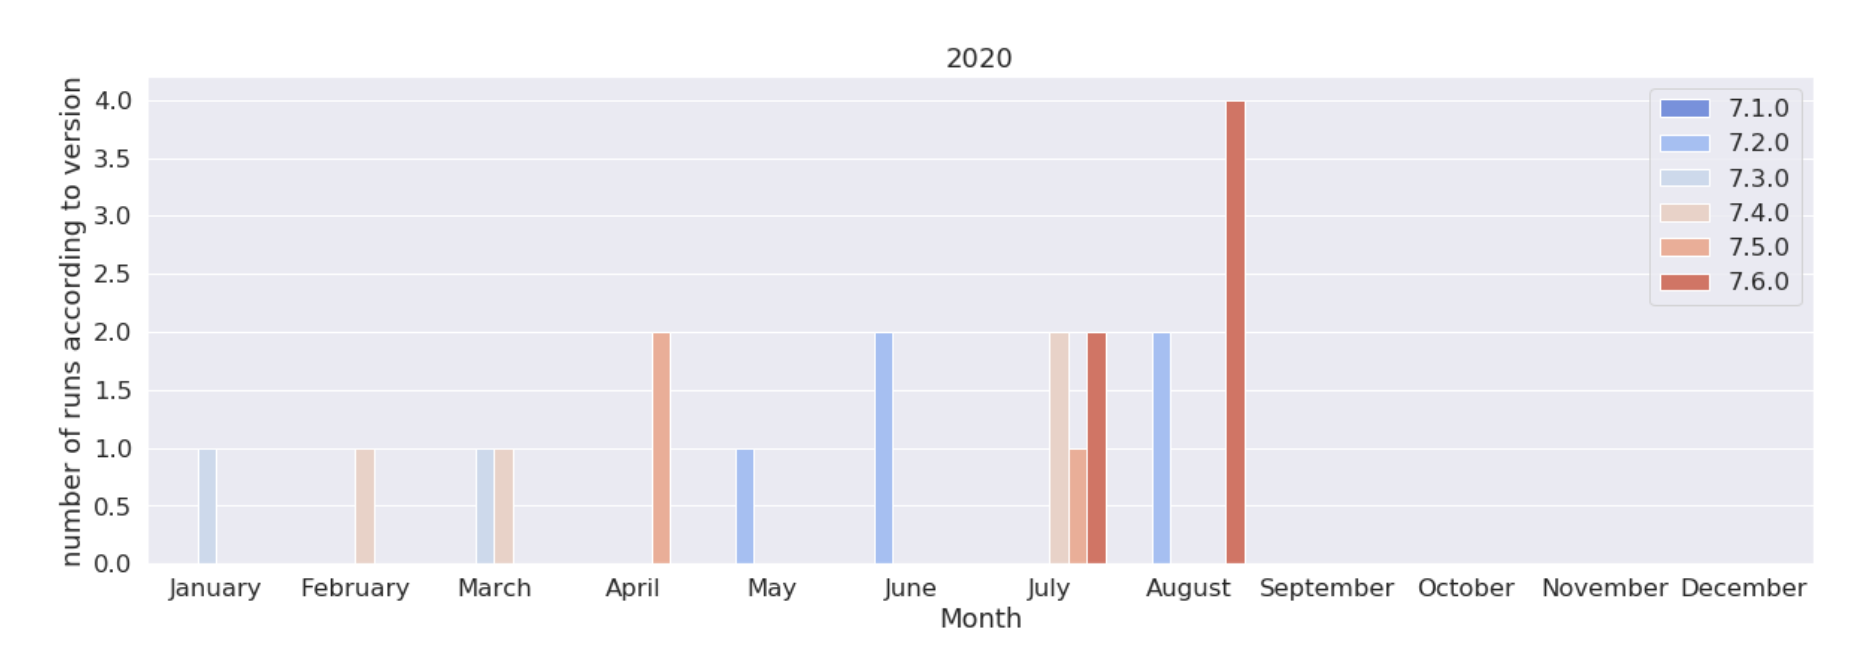
Version of the code used in 2018, 2019, 2020.
We see here that the 7.3, released in September 2018, was used a lot more that its sequels, until the 7.6 released in March. 2020. Note that 7.6 even got an “early bird” peak in December 2019 due to a pre-release test campaign.

“Popularity” of each versions among users, in decreasing order.
The popularity figure shows that user 2 and 4 never moved to the 7.6 version. User 4 stayed limited to the 7.3 version, while using 66% of the CPU hours.
Sorting families of simulations
Sorting is a machine learning task. Principal Component Analysis (PCA) reduces dimensions of data. It brings down a lot of components to a 2, 3, or 4 major components, while keeping the same diversity.
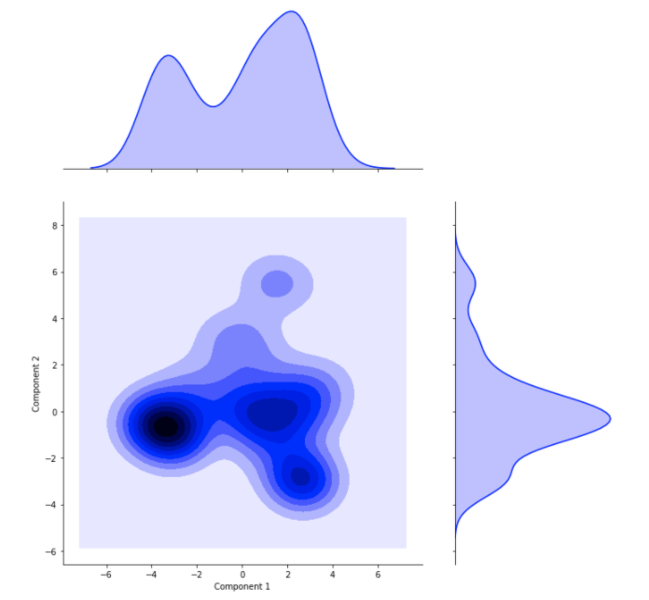
The simulations’ inputs parameters are reduced to two components able to reproduce the variety of the simulations. This cross plot shows the scattering or simulations along these two components. Two major clusters are visible, followed by one, maybe two minor clusters.
PCA gives simpler representation of the variability on the database, but no clue about what are these emerging clusters. We can gather groups of similar runs thanks to clustering. We see in the following 2-components scatter plot that runs have been automatically separated into three groups that have close parameters. This way runs can be sorted without human supervision and bias.
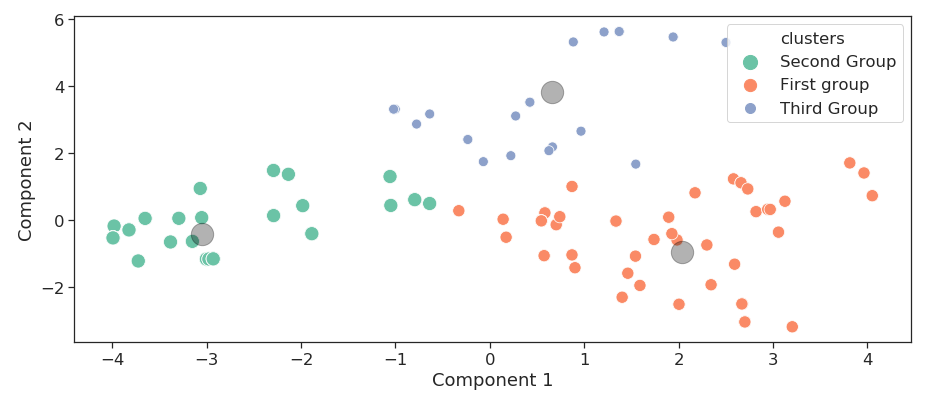
Three families of runs are gathered with a clustering analysis. Groups are sorted in population order: the first group include the biggest number of runs, followed by the second and the third.
Finally the initial components of the database are compared between the clustered families. A prominent component is therefore a specific trait of a family.
- numerical aspects

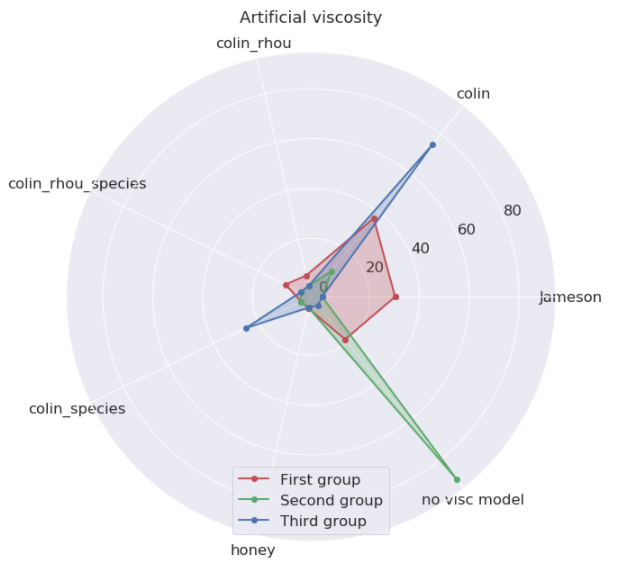
Two strong traits on the numerical aspects: the convection scheme and the artificial viscosity.
The three families are compared on two numerical aspects. The convection scheme used is a striking difference between the three. The numerical viscosity choice is also opposing the second and third group.
- Flow modeling
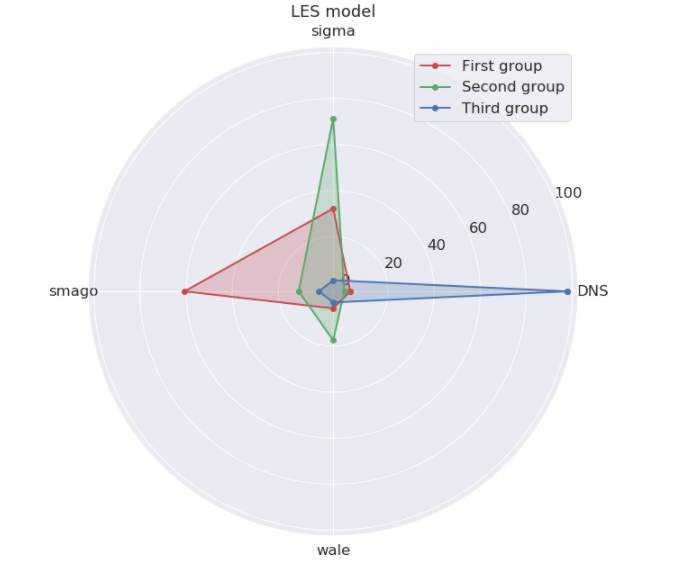
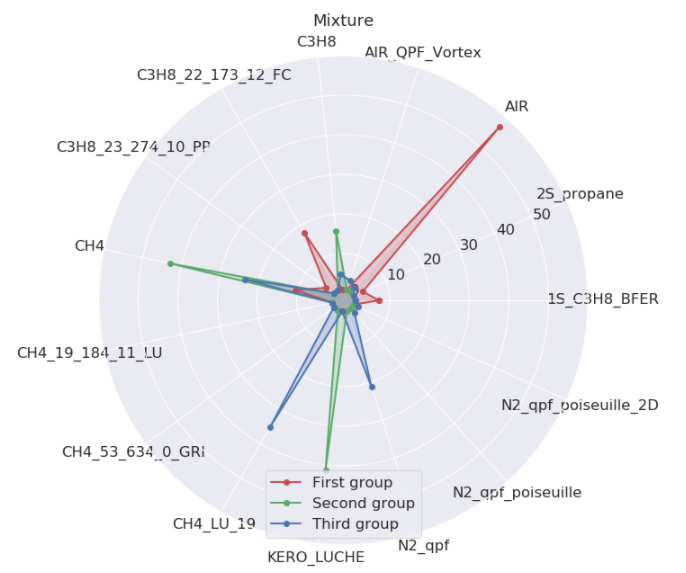
There is a clear segregation between families with the turbulence model (LES model). The gas mixture, on the other hand, allows no particular distinction.
The LES model is a fluid turbulence modeling. Again the three families use different modeling strategies (DNS means no model was used). The mixture name is the gas composition in use. Here no mixture is a unique trait for any families (AIR is the oxygen-nitrogen cocktail, KERO, C3H8 and CH4 are usual fuels. Other mixtures are for test purpose (*_qpf_*) or higher precision fuel kinetics (fuel)-_(n_specs)_(n_reac)*.)
This “family profiling” gives the following insight:
- The largest family is about non-reactive (AIR) configurations done with high order schemes (TTGC).
- The second family is the reactive runs with classic fuels (KERO, CH4, C3H8) with normal finite elements schemes (LW-FE). Surprisingly for an expert of AVBP, there is often no artificial viscosity, but a complex LES model (Sigma).
- The last group from clustering analysis is usually harder to profile. The third family is done with a normal scheme (LW) and no LES model, therefore laminar flow with no need of precision on the convection.
Drawback of the method
When applying these approaches, one should keep the McNamara Fallacy in mind, detailed by D. Yankelovich:
“The first step is to measure whatever can be easily measured. This is OK as far as it goes. The second step is to disregard that which can’t be easily measured or to give it an arbitrary quantitative value. This is artificial and misleading. The third step is to presume that what can’t be measured easily really isn’t important. This is blindness. The fourth step is to say that what can’t be easily measured really doesn’t exist. This is suicide. — Daniel Yankelovich, “Corporate Priorities: A continuing study of the new demands on business” (1972).
Until today, there was no strong incentive for a quantitative monitoring of the HPC industrial production in terms of phenomenon simulated, crashes encountered, or bad user habits. Those were not quantifiable and usually disregarded. If we add this kind of monitoring to the HPC toolbox more largely, we could also open a production hell where the monitoring metrics will become new additional constraints. By the means of Goodhart’s law, the production quality could even worsen under this new monitoring. We would have quit one fallacy just to stumble into another. If such initiative became a new layer of additional work, this would backfire: the mindset of the work presented here is to reduce the work, the stress, and the waste of both human and hardware resources.
In a nutshell
This worked example showed how to core information in the former jobs logs.
- A crawler explores the disks to find logs, and parses both the input and log files to feed a database.
- A specific process analyses the log file to provide error codes if these files are interrupted before a nominal end.
- Errors, version acceptation, and actual performance can be monitored from this database.
- The batch of simulations can be sorted in main families. First, run a Principal Component Analysis to reduce the complexity of the database. Second use clustering to gather jobs into families. Finally find the unique traits of families until these groups are making sense.
The tools used for this worked example should quickly be released as open source tools from the EXCELLERAT Centre of Excellence under the name of runcrawler.
Acknowledgements
The authors wish to thank M. Nicolas Monnier, head of CERFACS Computer Support Group for his cooperation and discussions, Corentin Lapeyre, data-science expert, who created our first “all-queries MongoDb crawler”, and Tamon Nakano, Computer science and data science engineer who followed-up and created the crawler used to build the database behind these figures. (Many thanks to the multiple proof-readers from the EXCELLERAT initiative, of course.)
Elsa Gullaud After a PhD in Acoustics, she is now doing a postdoc in data science at CERFACS.
Antoine Dauptain is a research scientist focused on computer science and engineering topics for HPC.
Gabriel Staffelbach is a research scientist focused on new developments in HPC.
